

Educational
Dec 30, 2025
SBIR vs. DARPA Funding Paths for Biotech Startups

Justin Zloty

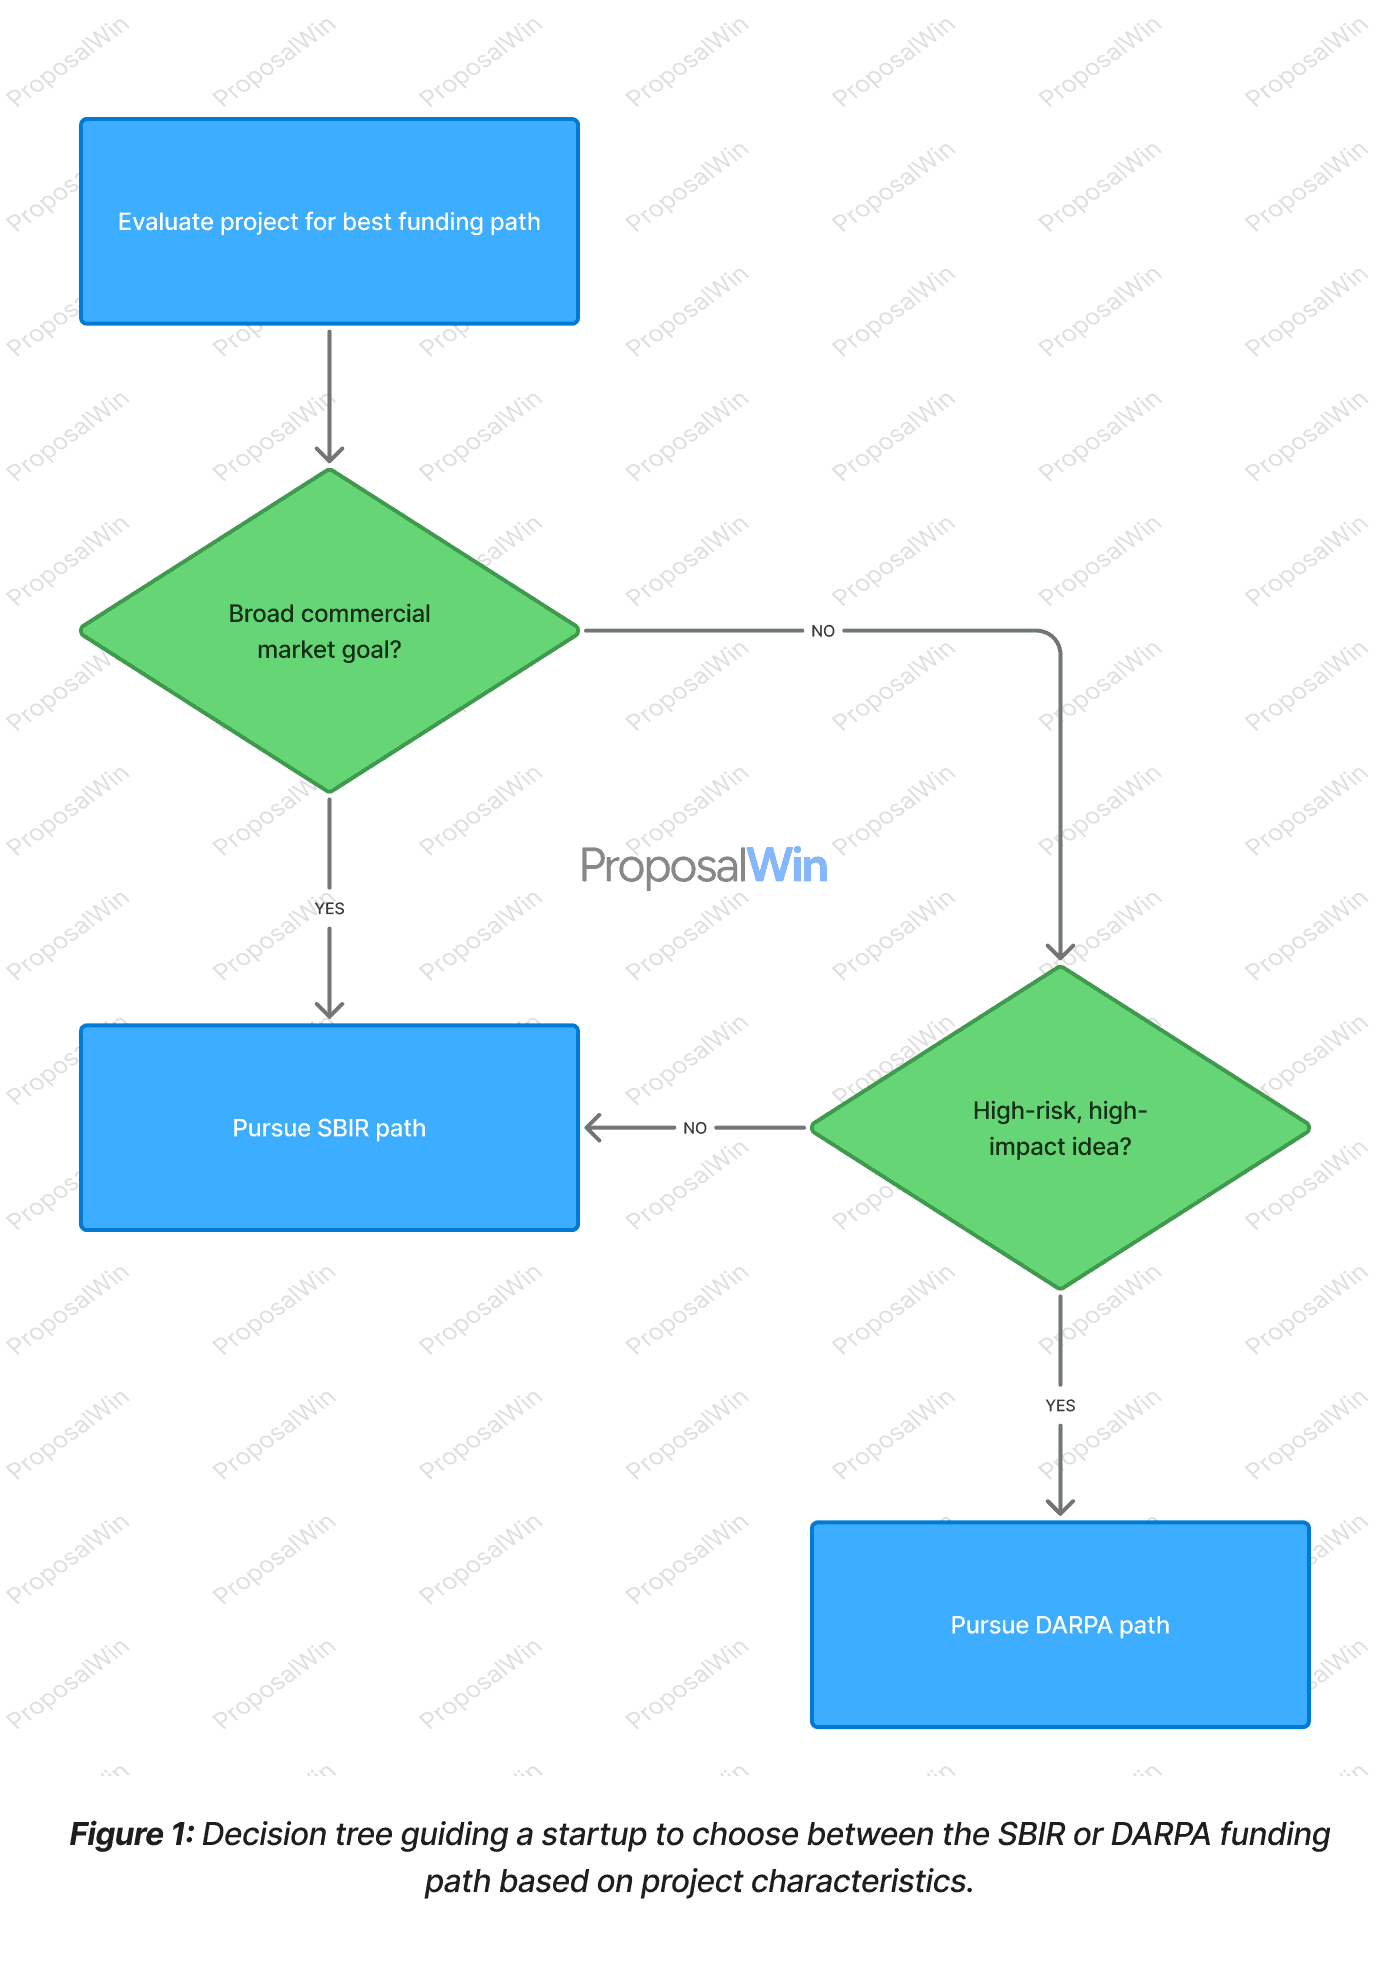
1. SBIR vs. DARPA Decision Tree
Strategic Alignment
The decision tree highlights key factors for choosing SBIR vs. DARPA. SBIR programs prioritize commercialization and are well-suited for projects with clear product markets. If a biotech innovation targets broad commercial use or incremental advancement, SBIR’s phased grants (often starting with 250K Phase I over 6 months) may provide a better fit. In contrast, DARPA focuses on defense-specific, high-risk/high-reward technology leaps. Projects that aim for revolutionary capabilities beyond current military needs align with DARPA’s mission and funding style.
Reviewers and program managers will interpret the choice accordingly: an SBIR proposal is expected to emphasize feasible development steps and a commercialization plan, whereas a DARPA pitch must boldly promise transformative impact for defense even if significant risk is involved. Choosing the wrong program can send a mixed message to evaluators, so aligning the project’s scope, risk, and end-use with the right funding path is critical.
Design Rationale
A decision tree visualization effectively communicates the branching logic of choosing between SBIR and DARPA. Each decision node poses a yes/no question about the project’s attributes (e.g. commercial focus or level of innovation), guiding readers down a specific path. This format mirrors the mental process a founder might take when evaluating options, making it easy to follow.
The tree structure also emphasizes how a "Yes" for broad commercial market or a "No" for extreme risk steers one toward the SBIR route, whereas a defense-centric, high-risk idea leads toward DARPA. By visualizing the decision criteria in a tree, the graphic aids cognition: readers can quickly grasp which conditions favor one funding source over the other. The clear separation of branches (with labels like "Yes" and "No") reduces ambiguity and helps ensure the audience understands the strategic reasoning behind each choice.
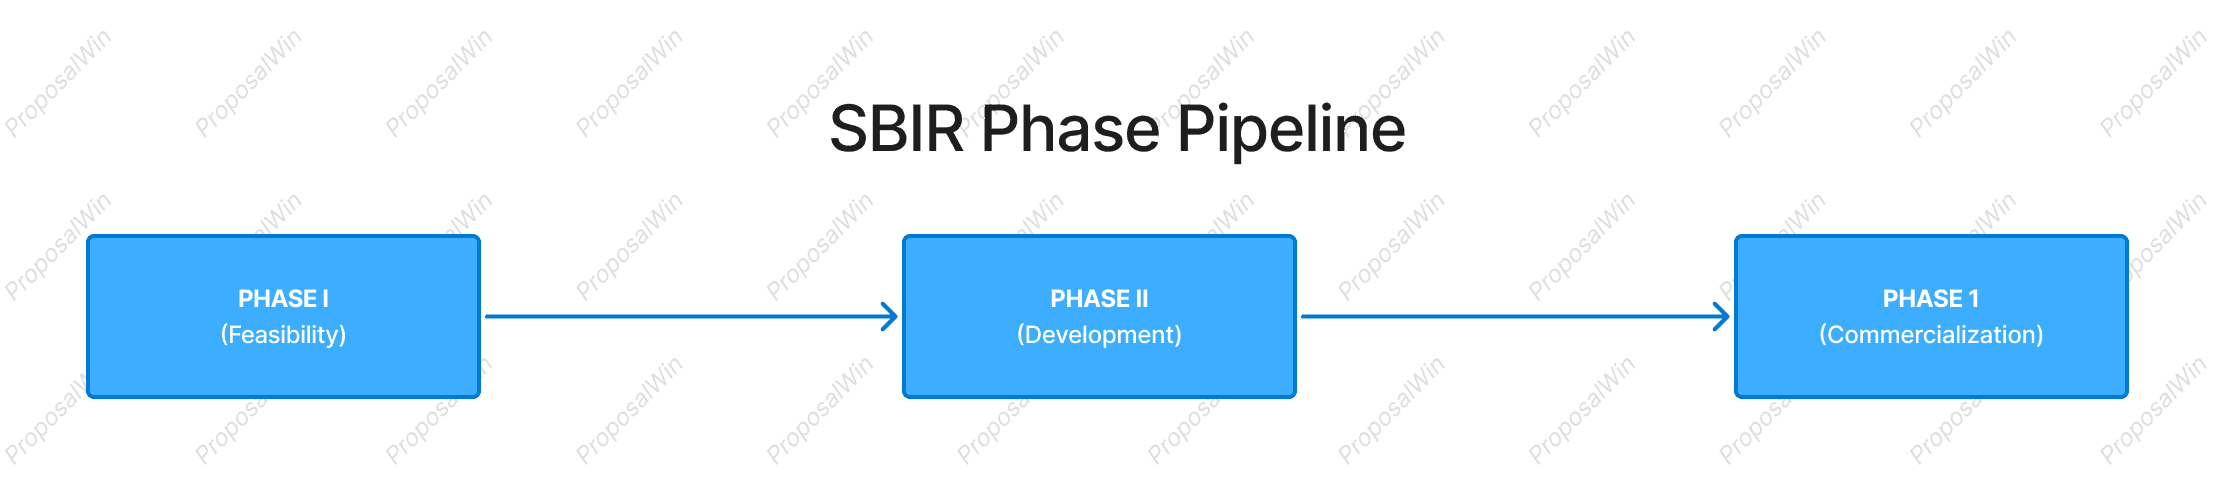
2. SBIR Phase Pipeline vs. DARPA Milestone Program
Strategic Alignment
This diagram contrasts SBIR’s structured pipeline against DARPA’s milestone-driven program. SBIR funding is divided into discrete Phase I and Phase II grants—each needing proposal evaluation and approval. For a medical/biotech startup, this means the project must achieve specific feasibility results in Phase I before securing a larger Phase II for further development. After Phase II, no additional SBIR funds are provided; success relies on outside investment or government procurement (Phase III).
In practice, SBIR is an incremental path: progress and continued funding depend on meeting each phase’s goals and convincing reviewers of the project’s scientific merit and commercial potential at every step. By contrast, a DARPA program usually provides a larger upfront contract that covers multiple phases of R&D with built-in milestones. Instead of reapplying for Phase II, DARPA performers continue to Phase 2 or 3 if they meet go/no-go criteria (technical benchmarks) during the project. This high-risk, high-reward model suits breakthrough biotech innovations that require significant resources and can tolerate the possibility of mid-course termination. The SBIR pipeline aligns better with projects that can be developed stepwise and have a clear commercialization plan, whereas DARPA’s approach fits ambitious projects aiming for a quantum leap in capability under guided oversight.
Design Rationale
We use a side-by-side timeline to visually juxtapose the SBIR and DARPA funding structures. The SBIR pipeline (top) is drawn as a linear sequence of three phases, emphasizing the stepwise progression and the handoff to external funding at Phase III. This linear flow communicates the idea of a phased pipeline where each stage is a gate for the next.
In contrast, the DARPA program (bottom) is shown with internal phases connected by "Go/NoGo" decision points, highlighting the built-in milestone reviews that DARPA uses to manage risk. By aligning the phases horizontally, readers can directly compare durations and critical junctures: for example, Phase I vs Phase 1, and the transition points.
The visual symmetry helps clarify differences—SBIR’s arrows simply continue if new awards are granted, whereas DARPA’s arrows are explicitly labeled with milestone checks to indicate possible termination points. This design choice (using text labels "Go/No-Go") draws attention to DARPA’s iterative evaluation, something a biotech founder must be cognizant of when planning project timelines.
Overall, the split diagram allows quick scanning of structural differences, reinforcing the message that SBIR offers a segmented pipeline with multiple proposal rounds, while DARPA provides a unified program with in-project evaluations.
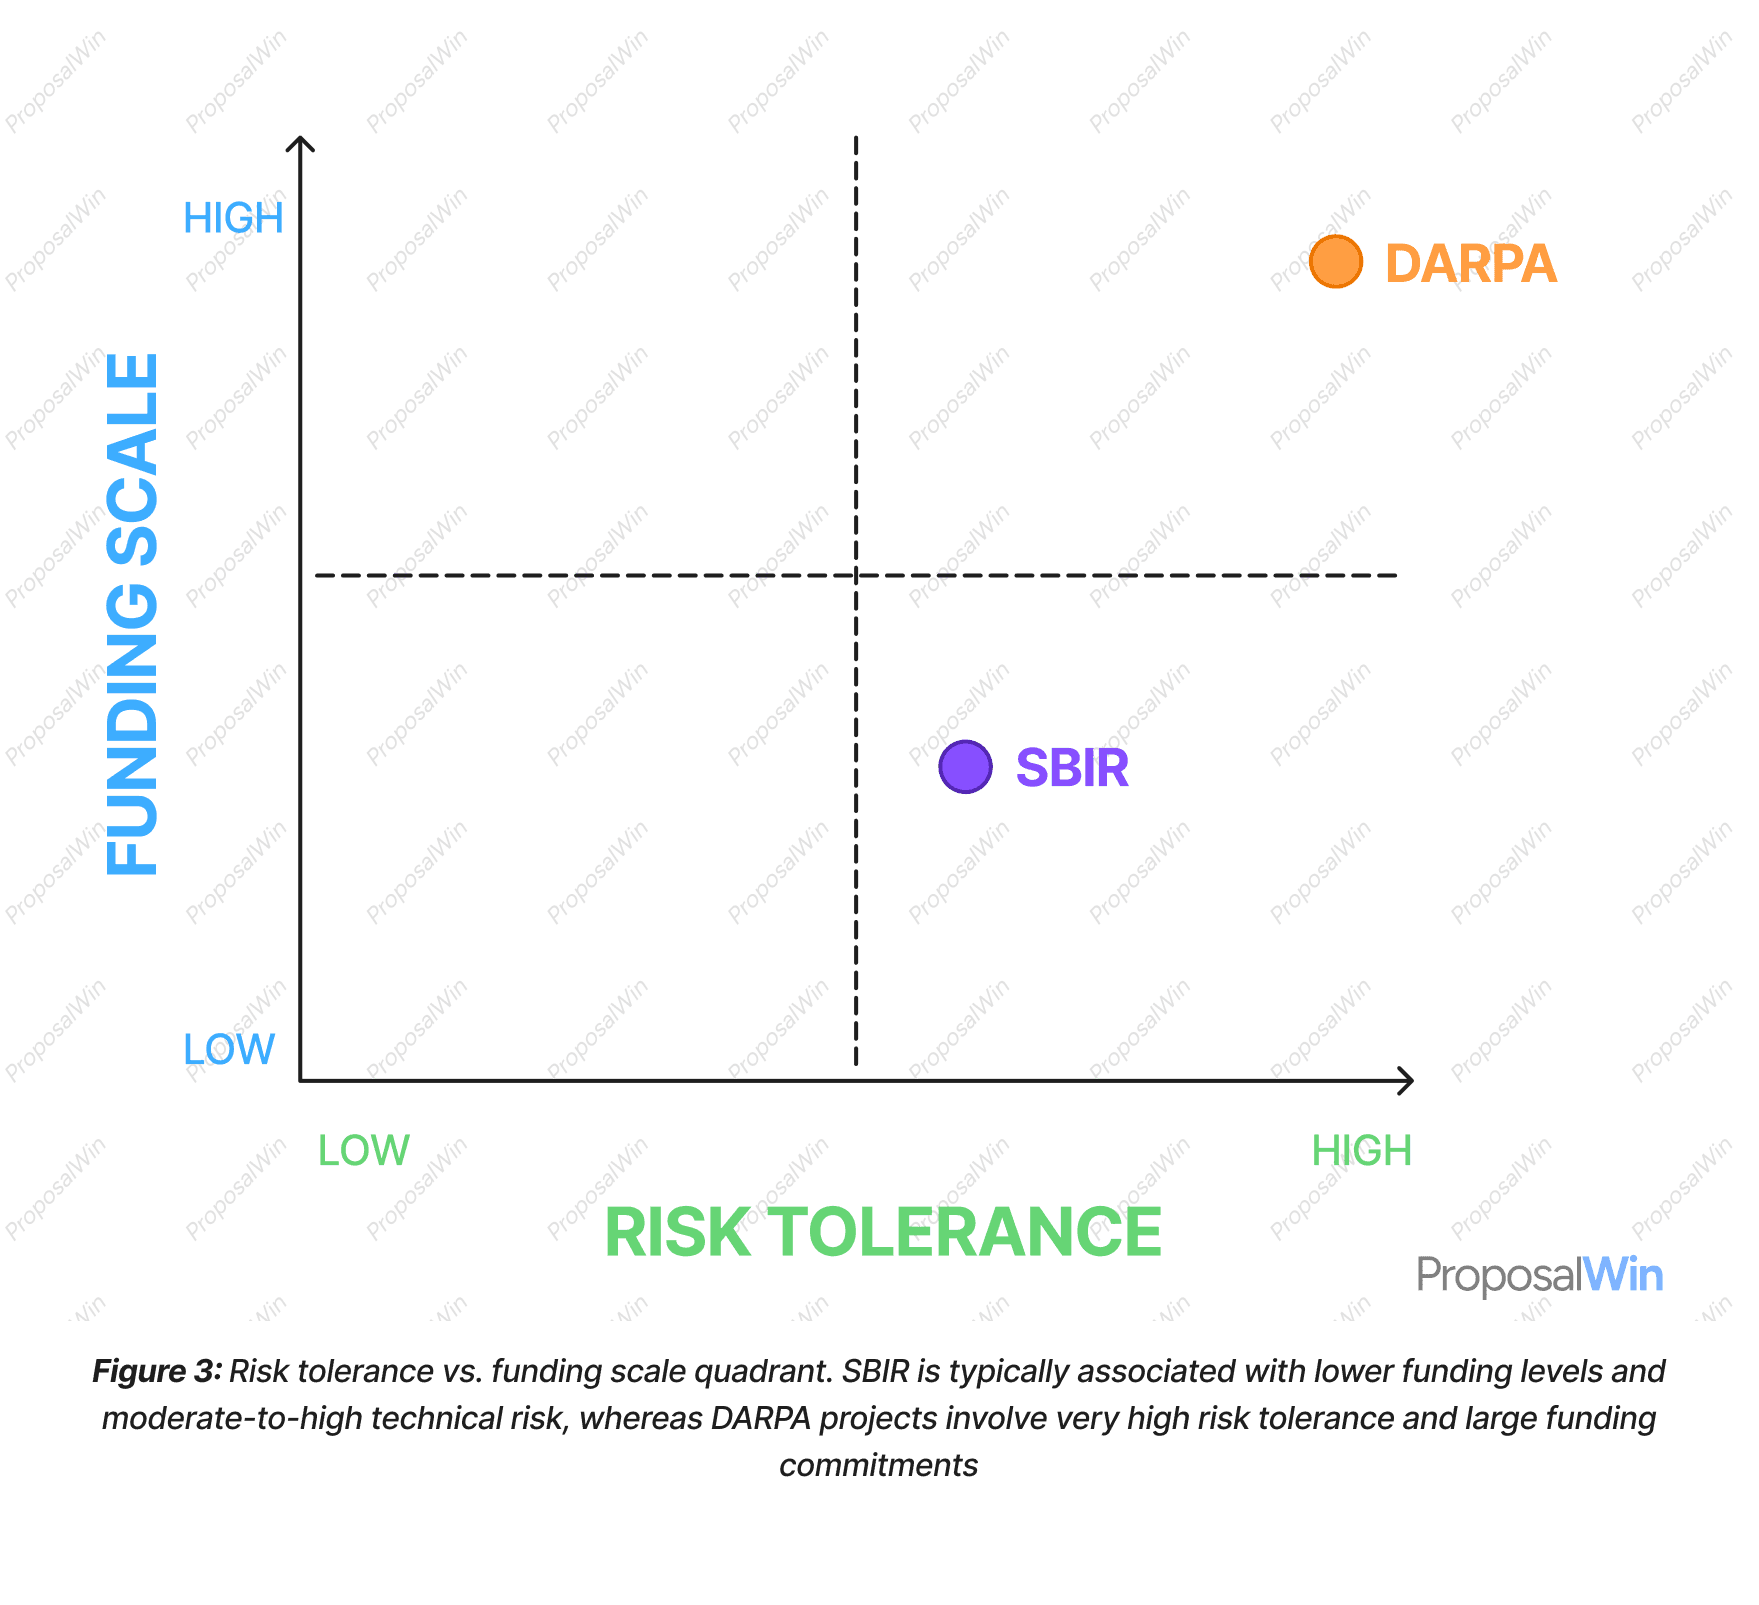
3. Risk Tolerance vs. Funding Scale Quadrant
Strategic Alignment
This quadrant chart maps how SBIR and DARPA differ in terms of acceptable project risk and available funding scale. SBIR/STTR programs are meant to fund high-risk research, but at a relatively small scale (e.g. 150K–1M in early phases). For example, a biotech startup developing a new drug delivery platform might secure an SBIR grant to explore feasibility, but the funding is capped and dispersed over phases, reflecting a lower overall investment and a somewhat cautious stepwise vetting.
DARPA, on the other hand, is known for making sizable investments (millions to tens of millions) in extremely risky, cutting-edge projects. In the defense biotech realm, DARPA might fund a moonshot project (like a pandemic response technology) with a high probability of failure, because the potential payoff is transformative.
The chart clearly shows SBIR in a region of “lower funding, moderately high risk” and DARPA in “higher funding, highest risk.” The implication for startups is to assess their project on these axes: if a project can be advanced with modest funds and has nearer-term commercial proof points, SBIR might suffice; if it requires a large upfront investment and entails breakthrough innovation with uncertain outcomes, only a DARPA-style approach (or similar high-risk funder) would provide the necessary support.
Recognizing where a project lies on this spectrum helps founders align their funding strategy with the expectations of each program’s reviewers and stakeholders – SBIR reviewers may expect more assured, incremental progress, whereas DARPA program managers embrace uncertainty in pursuit of revolutionary breakthroughs.
Design Rationale
The quadrant format is chosen for its ability to compare two variables at once. By plotting SBIR and DARPA on a grid of risk vs. funding, the graphic provides a visual shorthand for their fundamental difference in philosophy. We included dashed lines to divide the space into four quadrants (low/low, high/low, low/high, high/high) to categorize funding options in general. This not only positions SBIR and DARPA, but also implicitly suggests where other funding sources might fall (e.g. an NIH grant might be high funding but moderate risk, etc., though not explicitly labeled).
The use of a simple two-color scheme—blue for SBIR and orange for DARPA—along with distinct markers, ensures that the points stand out. Labels next to each marker allow the viewer to immediately identify which program is which without needing a legend. Annotations “Low” and “High” at the ends of each axis guide the reader in interpreting the plot.
This design leverages spatial reasoning: one can see at a glance that DARPA is up in the top-right extreme (the high-high quadrant) whereas SBIR sits lower. Such a visualization aids comprehension by distilling abstract concepts (risk tolerance and funding magnitude) into a clear, intuitive image. It essentially translates the funding philosophies into position on a map, which helps communicate why a startup might lean toward one program or the other based on its risk profile and resource needs.
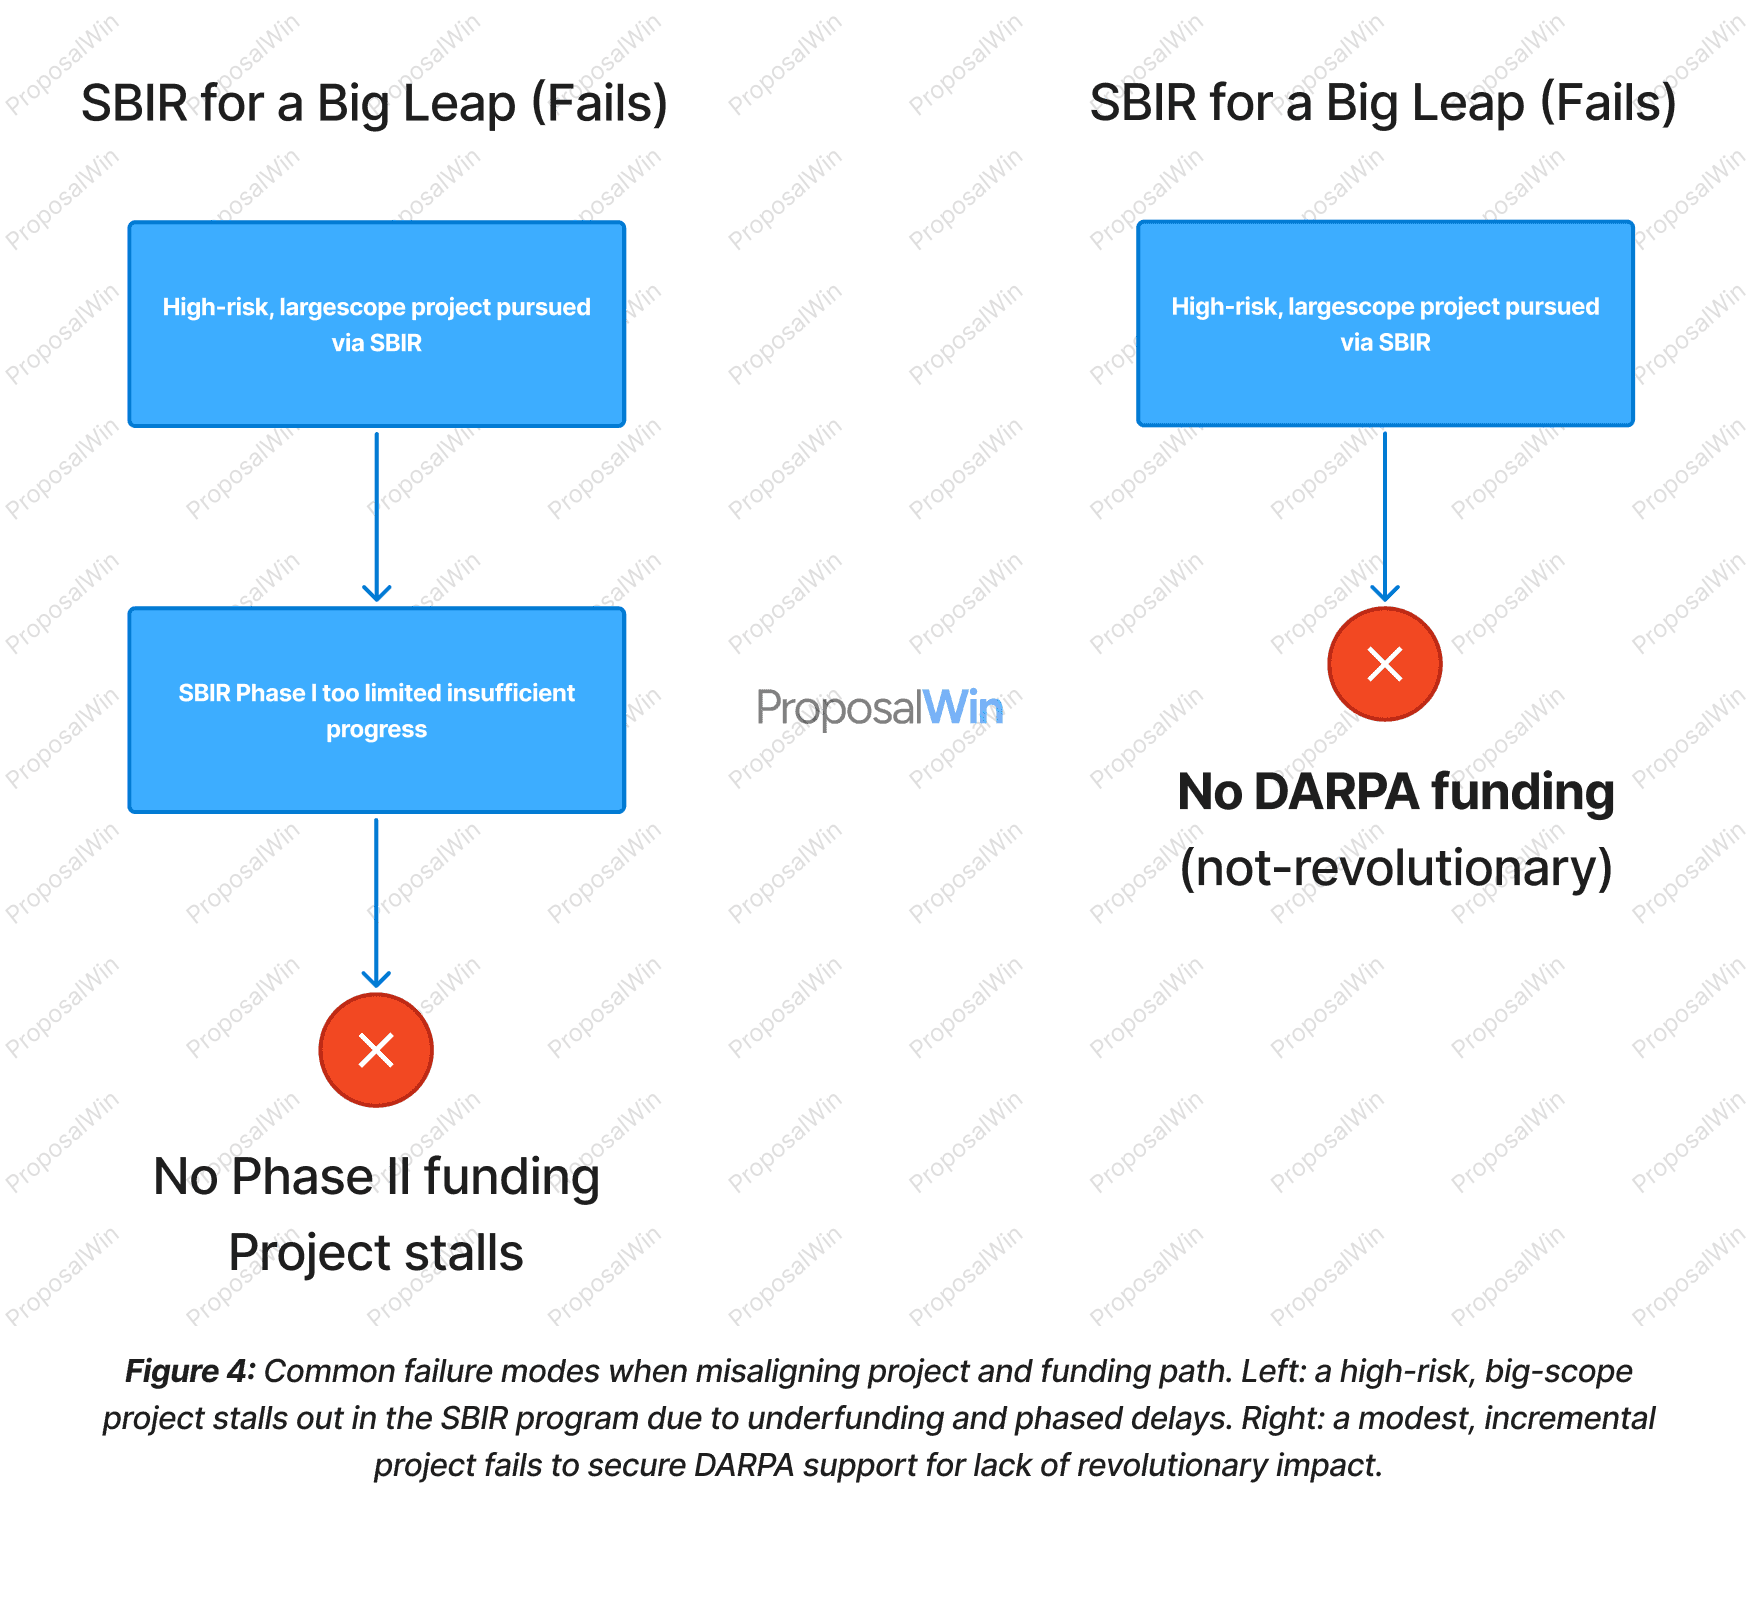
Common Failure Modes When Choosing the Wrong Path
Strategic Alignment
The left scenario illustrates the pitfall of attempting a DARPA-scale project within the SBIR program. An extremely ambitious biotech R&D effort (for example, a radical new bionano material) might flounder in SBIR because the Phase I award is too small and short to show meaningful progress. Lacking significant results, the project fails to win Phase II, and the funding pipeline ends—leaving the innovation stranded mid-development.
This failure mode is common when the project’s scope and risk demand a larger, more continuous investment than SBIR can offer. The right scenario shows the opposite misalignment: a relatively incremental improvement (say a slight enhancement to an existing medical device) is pitched to DARPA. Because DARPA seeks out paradigm-shifting ideas, an incremental project is likely deemed “not revolutionary enough” and never receives funding. The diagram’s DARPA path ends immediately with no award.
Even in cases where such a project did get initial DARPA funding (perhaps by being marketed as more revolutionary than it is), the risk is that it would later fail to meet DARPA’s aggressive milestones and be cut before completion. In both cases, the root cause is a mismatch between project nature and program expectations. Startups must candidly assess whether their project requires the large-scale, high-risk approach (if so, SBIR could under-resource it) or whether it is better suited to incremental funding (if so, DARPA may have no interest).
Recognizing these failure modes helps avoid wasted time: an underfunded project can burn through SBIR phases without reaching viability, while a mis-pitched DARPA proposal can divert effort from more suitable funding avenues.
Design Rationale
The left scenario illustrates the pitfall of attempting a DARPA-scale project within the SBIR program. An extremely ambitious biotech R&D effort (for example, a radical new bionano material) might flounder in SBIR because the Phase I award is too small and short to show meaningful progress. Lacking significant results, the project fails to win Phase II, and the funding pipeline ends—leaving the innovation stranded mid-development.
This failure mode is common when the project’s scope and risk demand a larger, more continuous investment than SBIR can offer. The right scenario shows the opposite misalignment: a relatively incremental improvement (say a slight enhancement to an existing medical device) is pitched to DARPA. Because DARPA seeks out paradigm-shifting ideas, an incremental project is likely deemed “not revolutionary enough” and never receives funding. The diagram’s DARPA path ends immediately with no award.
Even in cases where such a project did get initial DARPA funding (perhaps by being marketed as more revolutionary than it is), the risk is that it would later fail to meet DARPA’s aggressive milestones and be cut before completion. In both cases, the root cause is a mismatch between project nature and program expectations. Startups must candidly assess whether their project requires the large-scale, high-risk approach (if so, SBIR could under-resource it) or whether it is better suited to incremental funding (if so, DARPA may have no interest).
Recognizing these failure modes helps avoid wasted time: an underfunded project can burn through SBIR phases without reaching viability, while a mis-pitched DARPA proposal can divert effort from more suitable funding avenues.
For companies developing incremental medical devices, diagnostics, or software platforms, SBIR often represents the fastest and least risky funding option. For companies pursuing transformational therapies, advanced neurotechnology, or platform technologies with defense relevance, DARPA may be the only agency willing to fund the work at scale.
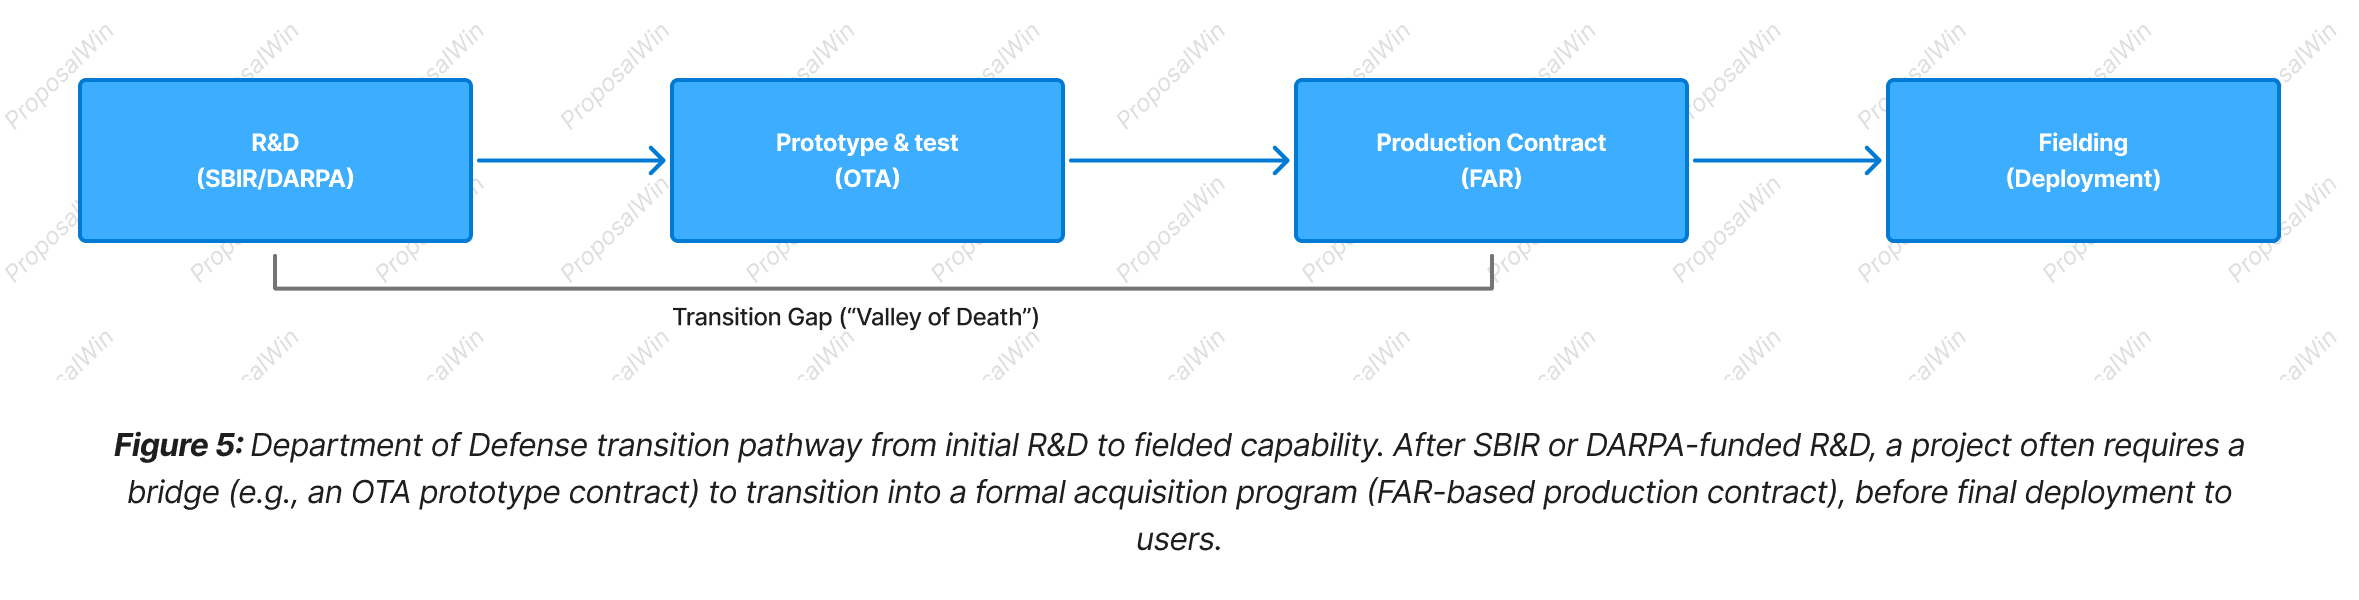
DoD Transition Path: From R&D to OTA/FAR Contract and Fielding
Strategic Alignment
This flow diagram charts the end-to-end journey of a defense-related biotech innovation, highlighting how both SBIR and DARPA-funded projects must ultimately transition to deployment. Early-stage R&D (leftmost box) might be supported by SBIR grants or a DARPA contract, getting the technology to a proof-of-concept or prototype stage. However, a successful Phase II SBIR or a completed DARPA research project is not the end goal in itself—the end goal is deployment of the technology to the field (rightmost box). The path between is often referred to as the “Valley of Death,” where many promising projects fail to secure the necessary funding and support to become operational products. To bridge this gap, the DoD uses mechanisms like OTA (Other Transaction Authority) agreements for prototyping. In the diagram, after initial R&D, the project enters a Prototype Test phase via an OTA. The OTA provides a faster, flexible contracting vehicle to refine the prototype with input from military end-users, essentially validating the solution in a realistic environment.
If the prototype proves out, the next step is a production contract governed by standard Federal Acquisition Regulations (FAR). This is when a formal program of record begins and larger-scale procurement happens (e.g., buying units for field use). Notably, SBIR Phase III often directly corresponds to this step—an agency can issue a sole-source FAR contract to an SBIR company to procure the developed solution. A critical insight for startups is the need to plan for this transition early: engaging a military customer or sponsor who will champion the project into an acquisition program is often necessary. Without a transition partner or strategy, even successful SBIR/DARPA projects can languish after the research phase. Thus, aligning the project with a clear DoD transition path (and using OTA/FAR tools appropriately) is key to actually deploying innovation to soldiers or patients in the field.
Design Rationale
The diagram is laid out as a linear progression from left to right to represent increasing maturity of the project. Each stage is shown as a distinct node, using the same visual style to indicate they are all phases in one continuous trajectory. Arrows connect the stages, reinforcing the temporal sequence and dependency (you must successfully cross each arrow to reach the next stage).
We included a bracket labeled "Transition Gap (‘Valley of Death’)" spanning under the first three stages to visually denote the perilous part of the journey between initial research and successful acquisition. This brace annotation draws the eye to the often-critical interface between R&D and implementation. By naming it explicitly, we ensure readers recall this well-known hurdle in technology development.
Each node’s label includes examples of the mechanisms at that stage (e.g., "OTA" for prototyping, "FAR" for production) to ground the abstract stages in concrete terms. This aids comprehension, as readers can map these terms to real-world processes: for instance, they may know that OTA agreements are used for rapid prototyping partnerships, and that FAR contracts signal a formal procurement.
The visual flow from research to deployment, with the final box labeled "Fielding (Deployment)," gives a sense of culmination—implying that the ultimate measure of success is delivering a usable product to end-users. The clarity of this left-to-right sequence helps communicate the idea that SBIR and DARPA are just the beginning; proper planning and execution of the transition steps are what carry a project to real-world impact.

Smarter Proposals. Stronger Submissions.
Ready to Submit Stronger, Fully Compliant Proposals?
Join the agencies and contractors who trust ProposalWin to deliver faster, better, compliant proposals, and see how much smoother your next bid can be.